Role of sensors in air quality (AQ) monitoring
Measurements of air pollution underpin a wide range of applications that extend from academic investigation to regulatory functions and services for the general public, governments, and businesses. A nationwide dataset on air pollution is required to raise awareness of pollution and for advancing research in associated fields. Also, public and media attention is increasingly conscious of the health and economic expenses of high outdoor PM pollution. Existing regulatory techniques for assessing urban air quality (AQ) rely on a small network of continuous ambient air quality monitoring stations (CAAQMSs) that are instrumented with expensive air quality monitoring gas analyzers and beta-attenuation monitors and provide highly accurate measurements (Sahu, Tripathi et al., 2021). However, these networks are established at a commensurately high setup cost and are cumbersome to maintain (Sahu, Tripathi et al., 2020), making rapid increase of dense CAAQMS networks impractical. Consequently, the AQ data offered by these sparse networks, however accurate, limit the ability to formulate effective AQ strategies. The “affordable” or “low-cost” sensor devices is a promising technology for increasing the density of the sparse urban PM pollution monitoring network. In developing countries like India, the implementation of such technology becomes a very relevant solution for large-scale deployment of a nationwide AQ monitoring network.
Streaming Analytics over Temporal Variables from Air quality Monitoring (SATVAM) initiative
SATVAM initiative has been developing low-cost air quality (LCAQ) sensor networks based on highly portable internet of thing (IoT) software platforms. The project aims to fundamentally redefine how AQ monitoring is done in India. At the time when the project started in 2017, India had under 200 continuous air quality monitoring stations across the country. All of the equipment used by the regulatory agencies that time was imported from the USA or Europe with the regulatory grade PM2.5 and PM10 BAM monitors costing upwards of $15,000 per BAM and for all the notified gas pollutants analyzers at US $200,000 per monitoring site. There was a recognised need for continuous AQ monitoring in the 7000+ census cities and towns of India. The SATVAM team had embarked on building India’s first scientifically validated and calibrated air quality monitoring network for pollutants PM2.5, PM10, NOx and Ozone by rigorously evaluating LCAQ sensor devices and networks in harsh resource constrained environments.
A large-scale deployment of the SATVAM network has been well-underway around for the past at the IIT Kanpur campus. Researchers and active citizens had access to the continuous hourly data for making better health-related decisions as well as understanding the long-term AQ trends in different locations of the campus.
Based on all of the work done in the SATVAM project, the Maharashtra Pollution Control Board (MPCB) commissioned a project to IIT Kanpur for rigorous field validation of PM2.5 and PM10 based monitors built by 4 leading start-ups of India. The results of the field evaluation at 15 different locations of Mumbai have been extremely promising and have encouraged the Maharashtra regulator to consider deploying this sensor technology in thousands of locations in Maharashtra. The Chairman of MPCB has been in touch with the PI of SATVAM, Prof. S.N. Tripathi, to understand the use of “mobile vans” equipped with reference monitors for dynamic field calibration of the sensor devices on a year-round basis across the city. On 20 May 2021, the Ministry of Environment Forests & Climate Change (MoEFCC) reconstituted the Steering Committee for implementation of the National Clean Air Programme (NCAP). The PI of SATVAM has been nominated as an expert committee member of this flagship programme of the central government for clean air in India. Based on the scientific papers and the results from the SATVAM project shown to the committee, there is now a broad consensus within the NCAP policy makers to implement this sensor-based technology in few more cities of India.
Along with this, The National Health Systems Resource Centre (NHSRC), being part of the Ministry of Health and Family Welfare (MoHFW) has commissioned IIT Kanpur, led by the PI of SATVAM and the industry partner Respirer Living Sciences, to deploy a variant of the SATVAM monitors to evaluate the health effects from the changing AQ for the beneficiaries of the Pradhan Mantri Ujjwala Yojana (PMUY). Nearly a 100 AQ monitors have been deployed in 6 states of India, covering 12 districts each with varying levels of PMUY beneficiaries, from amongst the highest PMUY beneficiaries to the lowest density (https://www.youtube.com/watch?v=X2EktGr_69s)
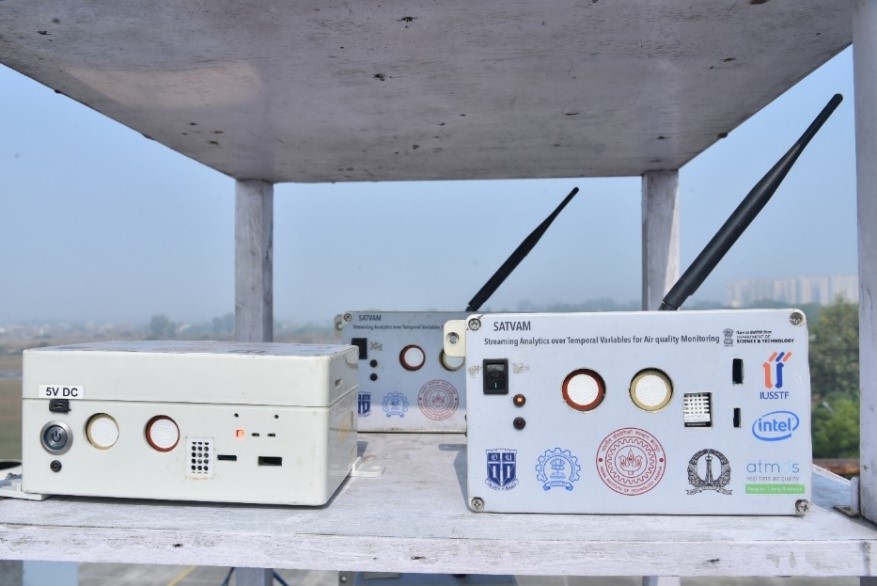
Field deployed low-cost air quality (LCAQ) monitoring SATVAM sensor
Key highlights from published papers of IIT Kanpur’s research group
Researchers at IIT Kanpur, India, in collaboration with national and international institutes have conducted research works aimed towards establishing India’s first scientifically validated and calibrated AQ monitoring network for pollutants PM2.5, PM10, NOx, and O3 by comprehensively analysing low-cost sensor networks under diverse climatic circumstances. PM2.5 sensor data has been found to be within 10% of ambient values, as measured by E-BAM, with appropriate RH corrections and linear/quadratic fit calibration (Zheng, Tripathi et al., 2018). Particulate Matter (PM2.5 and PM10) sensor data performance has been rigorously evaluated in the field in both low- and high-concentration environments. For O3 and NO2 calibration that were based on k-nearest neighbour distance metric learning, R2 were as high as 0.92 and 0.82, respectively, and exhibited a 4–20% improvement over the traditional non-parametric techniques NO2 (Sahu, Tripathi et al., 2021). PM10 levels using un-calibrated sensors co-located with research-grade equipment also showed a good correlation (R2 as high as 0.84) in Delhi (Sahu, Tripathi et al., 2020). A novel approach based on Gaussian process regression with on fly sensor calibration was also developed for the calibration of PM2.5 sensors in Delhi. Over 22 reference nodes, the method used a leave-one-out cross-validation procedure, which resulted in an overall predicted error of 30% (RMSE 33 μg.m-3) on a 24-h scale. Dynamic field calibration and surveillance of the city-level air quality network have been done using machine learning techniques such as Gaussian process regression (Zheng, Tripathi et al., 2019). In another work for PM2.5 sensors calibration, a domain adaptation-based method that can reduce the need for co-located data is proposed and the R2 is observed as high as 0.88. The use of very low-powered wireless network solutions using peer-to-peer 6LoWPAN technology (Simmhan, Tripathi et al., 2019) and energy harvesting powered IoT systems (Sharma et al., 2020) have been deployed in the real-world in India for the first time. A calibration approach based on Model-Agnostic-Meta-Learning (MAML) showed the RMSE as low as 10.3 μg.m-3 in PM2.5 measurements (Yadav, Tripathi et al., 2021).
Multicity deployments related information
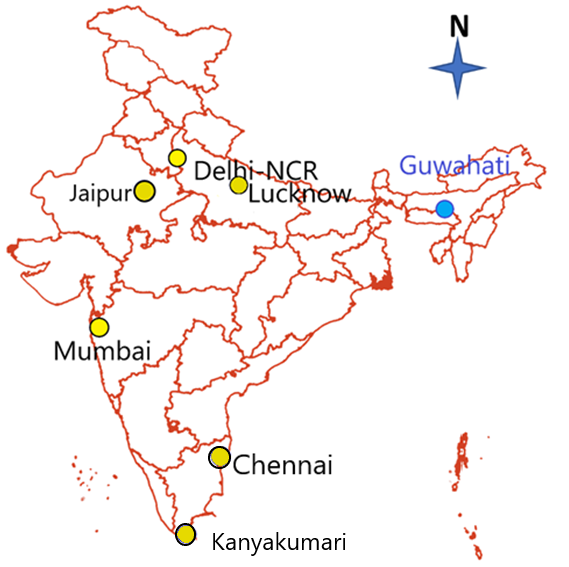
• BLUE CIRCLE: will be deployed soon
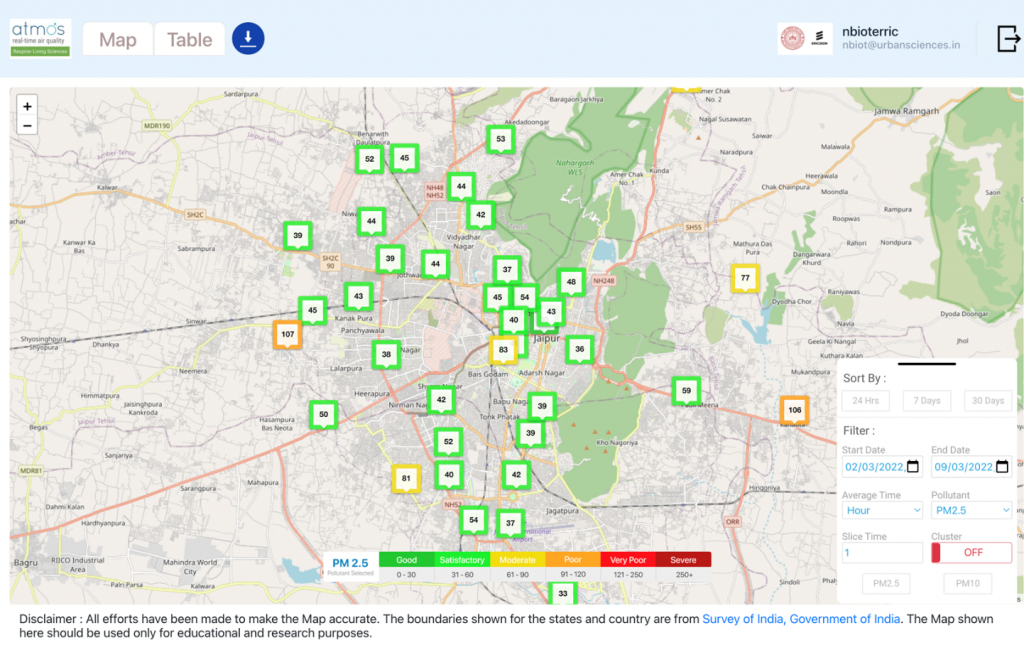
Low-cost air quality (LCAQ) sensor network deployment for PM2.5 air quality monitoring at Jaipur
In collaboration with Rajasthan Pollution Control Board (RSPCB) and Ericsson, the Indian Institute of Technology (IIT) Kanpur is running the city-scale AQ monitoring project. IIT Kanpur has a Memorandum of Understanding (MoU) with RSPCB and Ericsson India is funding the research. This LCAQ monitoring sensor-based project is led by Prof. Sachchida Nand Tripathi, Department of Civil Engineering, IIT Kanpur. RSPCB has helped IIT Kanpur in deploying the LCAQ sensors at 40 important locations of Jaipur which are identified as the hotspots for air pollution. These LCAQs will continuously monitor PM2.5, PM10, and air quality index (AQI) concentrations measured in the area, providing useful and vital information on air pollution levels. It will aid in raising public awareness about air pollution among Jaipur residents. IIT Kanpur has also introduced a mobile app “Airveda” during the inaugural day of making LCAQ network data available into open domain, as part of a collaborative effort, via which pollution data may be accessed online. Interactive plots on temporal data of PM2.5, PM10, and AQI levels for these 40 identified locations, comparative studies between days, months, even seasons, and from site-to-site, as well as a map depicting the data of the relevant sites, are among the features of the mobile app. It will help us to understand the generated data on PM and AQI in a more meaningful way. Deployment sites for these LCAQ sensors include High Court Circle Jaipur, Panchyawala, Paldi Meena, Adarsh Nagar, Jamdoli, Adinath Nagar, Kanota, Police Commissionerate Campus, RSPCB Head Office Jhalana Dungari, Regional ffice North RSPCB, Near VKIA Police Station, Near Jawahar Circle Regional Office South RSPCB, Niwaru, Vidyadhar Nagar, Badi Chaupar, Benar Road, VKIA area, Mansarovar, Bhakrota, Bikaner Agra Marg, Gurjar ki Thadi, Near Chirayu Hospital, Chandpole, Vaishali Nagar, Kukas, Sanjay Nagar, Collectorate campus Jaipur, Yadgar, near Brahmapuri Thana, RIICO office VKIA, Sitapura Industrial Area, Airport Sanganer, Thadi Market, Secretariat campus Jaipur, Madhyam Marg-Mansarovar Jaipur, Ashind Nagar-Sanganer Road, near Chomupulia, Raghunathpur, Shastri Nagar, Sirsi Road Jaipur, and MNIT JNU Marg Jaipur.
Low-cost air quality (LCAQ) sensor deployment for PM2.5 air quality monitoring at Lucknow and Kanpur
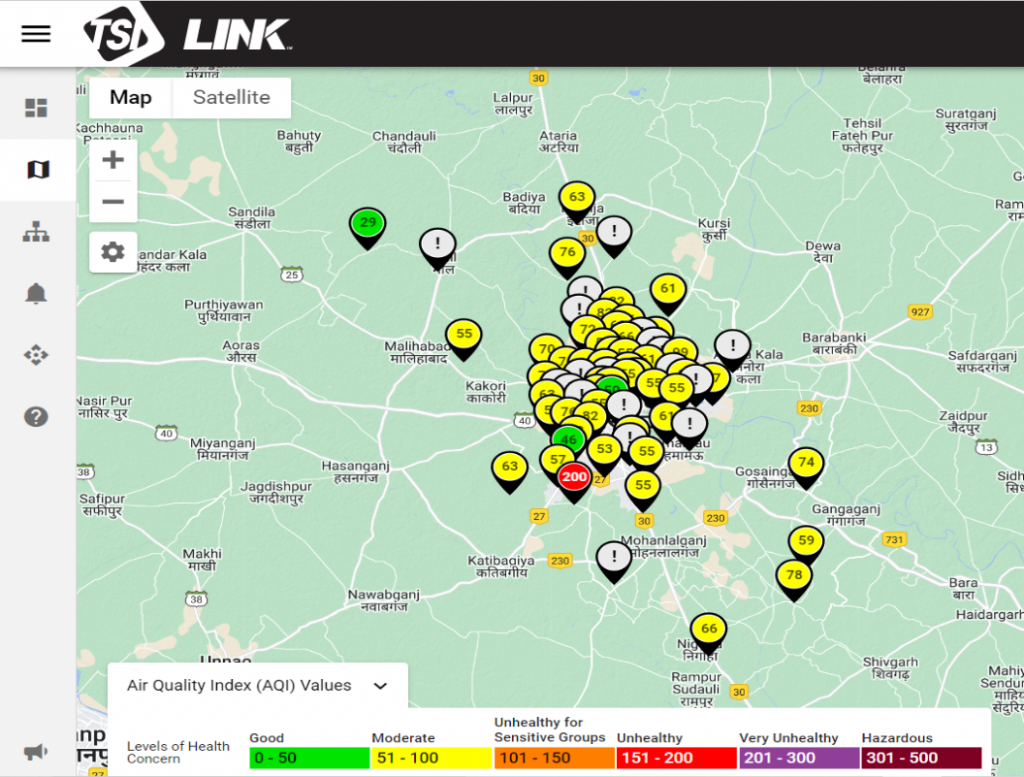
Lucknow is the capital of the state of Uttar Pradesh (UP) in India which frequently ranks within the list of world’s most polluted cities. The IIT Kanpur in collaboration with Uttar Pradesh Pollution Control Board, Government of Uttar Pradesh is working on a joint Indo- US project aimed at monitoring and improving the AQ in Lucknow. The main objective of the study is to develop and implement plan to reduce PM2.5 concentrationusing a combination of data gathered using satellite image-enhanced PM2.5 sensor network, integrated with meteorological modeling and source apportionment. In the process, a fleet of 71 LCAQ sensors (make: TSI, Model: 8143 BlueSky) are deployed throughout Lucknow for real-time AQ monitoring to provide high-resolution spatio-temporal PM2.5 data. The sites for the placement of these monitors were selected on the basis of their land use pattern and area representativeness characterized by inclusiveness of different sources. These included industrial regions, commercial and city centres, residential areas, rural sites, roadside areas, etc. Three of these monitors were also collocated with the UPPCB monitored regulatory instruments – CAAQMS. Prior to deployment, these sensors were tested for performance with the gold standard instrument at one-hour time integration. The linear regression model was performed which achieved a marked improvement from pre calibration (Mean Absolute Percentage Error, MAPE = 81.96 % to 37.24%) to post calibration correlation (MAPE = 16.67% to 12.73%) thereby validating their suitability for deployment. The on-field sensor comparison with CAAQMS showed promising results with R2 between 0.68 to 0.82. A transfer learning model (RF-CNN) was used for PM2.5 prediction using the microsatellite images integrated with CAAQMS data. The model predicted PM2.5 values with high spearman correlation r ~ 0.88 and RMSE ~ 37.69 for the test data. The two major on field requirements for hosting these monitors included continuous power supply (5W, 240 V) and Wi-Fi connectivity. The hosts in Lucknow are different research organizations, government offices, schools, hospitals, and universities and colleges. The data obtained is being studied for descriptive analysis on spatial and temporal scale and to identify the hotspots for air pollution.
The AQ monitoring is also conducted across Kanpur city by deploying PM2.5 sensors at NSI Kalyanpur (CAAQMS site), Kanpur Zoo, Nehru Nagar (CAAQMS site), Panki, Fazal Ganj, Jareeb Chowki, Ramadevi Chowraha and FTI, Kidwai Nadar (CAAQMS site). Following to it, gas sensors deployment will also be deployed next to each PM2.5 sensor and to MahindraTech LCAQs which are deployed under smart city scheme.
Sensor deployment and data collection in Mumbai
Mumbai, the capital of Maharashtra, is India’s second-most populous metropolis, after Delhi, and the world’s seventh-most populous city, with a population of around 20 million people.
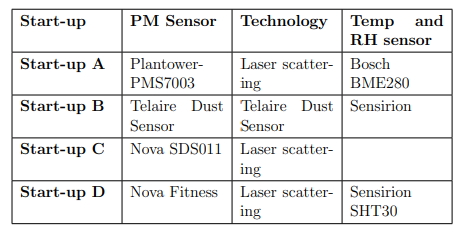
The LCAQ devices are deployed in Mumbai Metropolitan Region (MMR) Maharashtra, India. Following sites has been selected for the collocation of the LCAQ devices and CAAQMS: Airport, Sion, Nerul, Vile Parle, Mahape, Vasai, Borivali, Kalyan, Powai, Colaba, Mulund, Bandra, Kandivali, Worli, and Kurla. Four start-ups are selected for the deployment of the LCAQ devices named as start-up A, B, C and D (Table 1). LCAQ of start-ups A and D were deployed at all the 15 identified sites whilestartups B and C deployed their LCAQ sensors at 5 sites; namely: Airport, Sion, Nerul, Vile Parle, and Mahape.
The LCAQ sensors deployment and data collection started from November 1st, 2020 and continued till May 31st, 2021. The details of the PM, RH, and temperature sensors are listed in the Table 1. The data is available at an interval of 15 minutes, 30 minutes, and 60 minutes for CAAQMS, and 1 minute, 15 minutes, 30 minutes, and 60 minutes for start-up A. For start-up B, the data is available at an interval of 1 minute. For start-up C, the data is available at an interval of 15 minutes, and 1 hour. And for startup D, the data is available at an interval of 1 minute, 30 minutes, and 60 minutes.
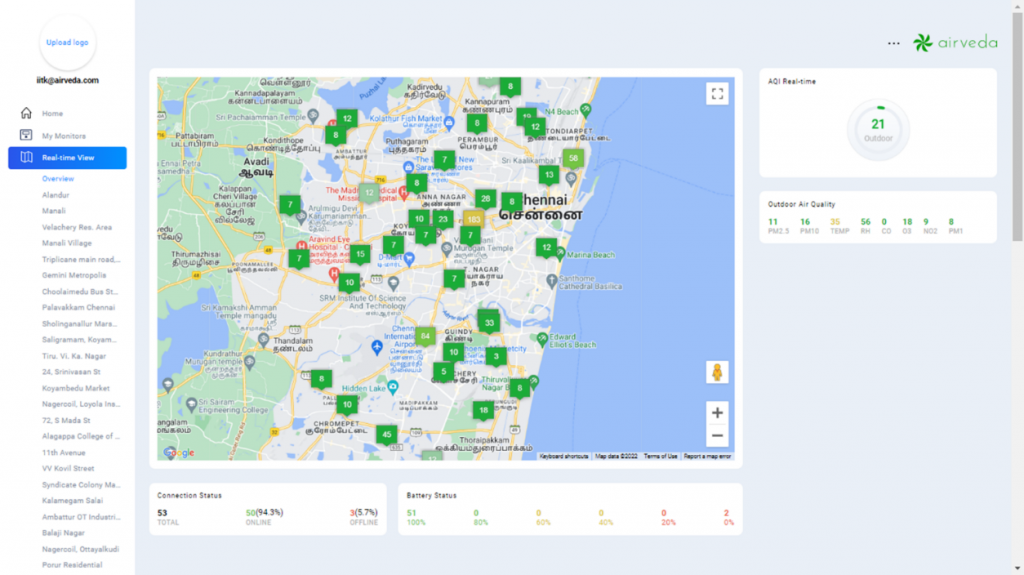
Low-cost air quality (LCAQ) sensor deployment for PM2.5 air quality monitoring at Chennai city and Kanyakumari district
Deployment locations for 40 LCAQ sensors in Chennai city are:
Nelson Manickam road, Choolaimedu bus stop, Anna University, Koyambedu Market, Vanagaram Industrial area, Alwar Thirunagar Valasaravakkam, Velacherry, Pammal, Thiruverkadu, Railway quarters Egmore, Ambattur Residential, Ashok Nagar, Selavoyal, Mathur, Manali village, PWD office Taramani, Sowcarpet, Thiruvottriyur, Kodungaiyur, CSI Ewart School, Ambattur Industrial estate, Perungudi BAM, Kodungaiyur BAM, South Thirumalai Nagar, Konnur, Koyambedu BAM, Porur Residential, Tylors Road BSNL Quarters, Ice house, Thiru. Vi. Ka. Nagar, Velachery K S Hospital, Madhavaram milk colony, Kodambakkam Residential, Solinganallur Marsh Land, Saligram, Chrome pet Traffic and Industrial Area, Palavakkam Residential, Ambattur near TI Cycle Company, Manali CPCB, Pallikaranai Marsh land, Kattupakkam Traffic area and Nanmangalam Traffic area.
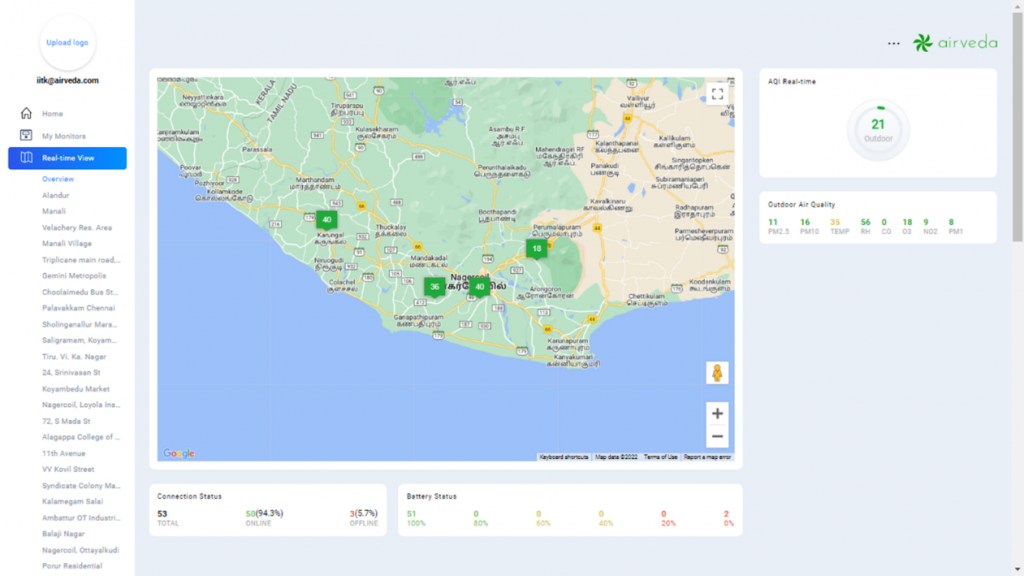
Deployment locations for 4 LCAQ sensors in Kanyakumari district are:
Perumal Nagar, Karungal, Ottayalkudi and Loyala Institute of Techonology and Science, Thovalai.